|
|
Hi everyone!
Last week, Bitcoin traded in a 9% range before closing near $70,000, about 3% higher than the week's opening price.
The altcoin market cap climbed with Bitcoin, rising from approximately $967 billion to $993 billion.
Keep an eye on these three coins with upcoming events, picked by our community, as BTC bears fight to defend their stops above Q1's range highs.
Follow on X: @tpchartstrading
|
|
|
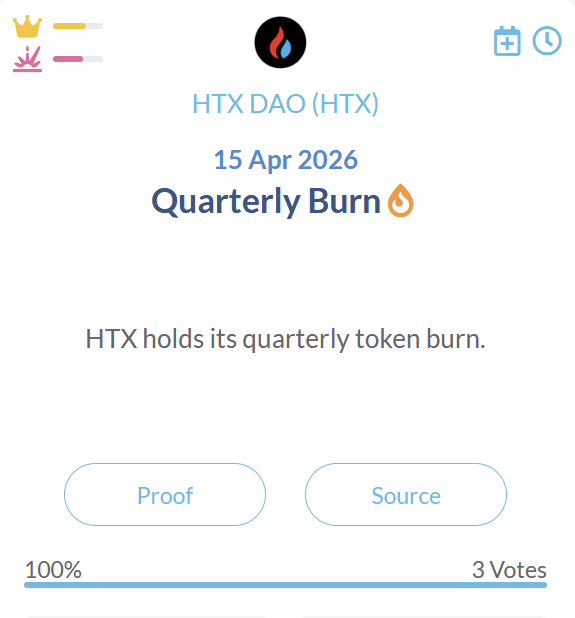
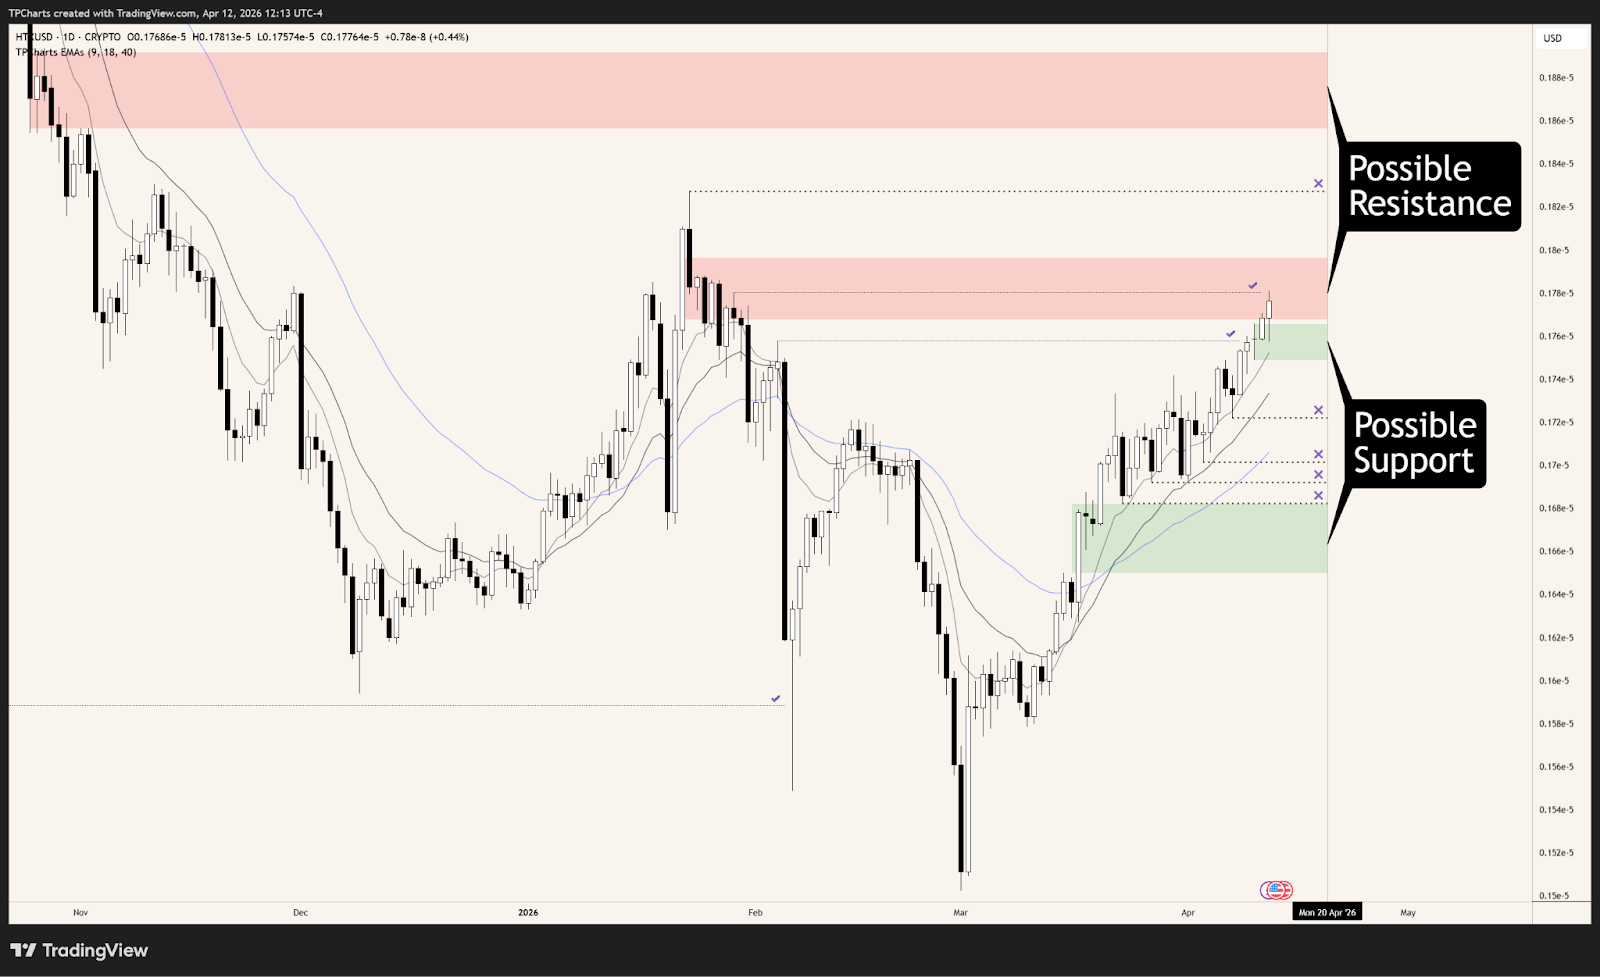
HTX rallied 18.6% from February’s low after sweeping bulls’ stops under June’s low.
The price is pushing into possible resistance between $0.000001768 and $0.000001797, taking bears’ stops above January 29th’s swing high at $0.000001780 into the bearish rejection created by January 12th’s weekly candle.
The upcoming quarterly burn event on Wednesday could encourage traders to "sell the news," potentially increasing selling pressure and helping bears defend this zone.
Support might begin nearby at $0.000001766, where bulls accumulated while traders took profits at February 4th’s high. This level is marked by April 10th’s daily candle and reinforced by the 9-day EMA. The proximity of this level to resistance may trigger consolidation if bulls can’t push through the nearest resistance on the first try.
If the price breaks through resistance, it could attack bears’ stops above January’s high at 0.0000018273. Above this level, October’s bearish monthly void from $0.000001892 to $0.000001857 offers the clearest higher-timeframe resistance.
A bearish turn could put bulls’ stops trailing under swing lows at $0.000001722, $0.0000017016, $0.000001692, and $0.000001683 at risk. The lowest of these lows is adjacent to higher-timeframe support marked by March 16th’s bullish weekly void, spanning from $0.000001650 to $0.000001683.
|
|
|
|
|
|
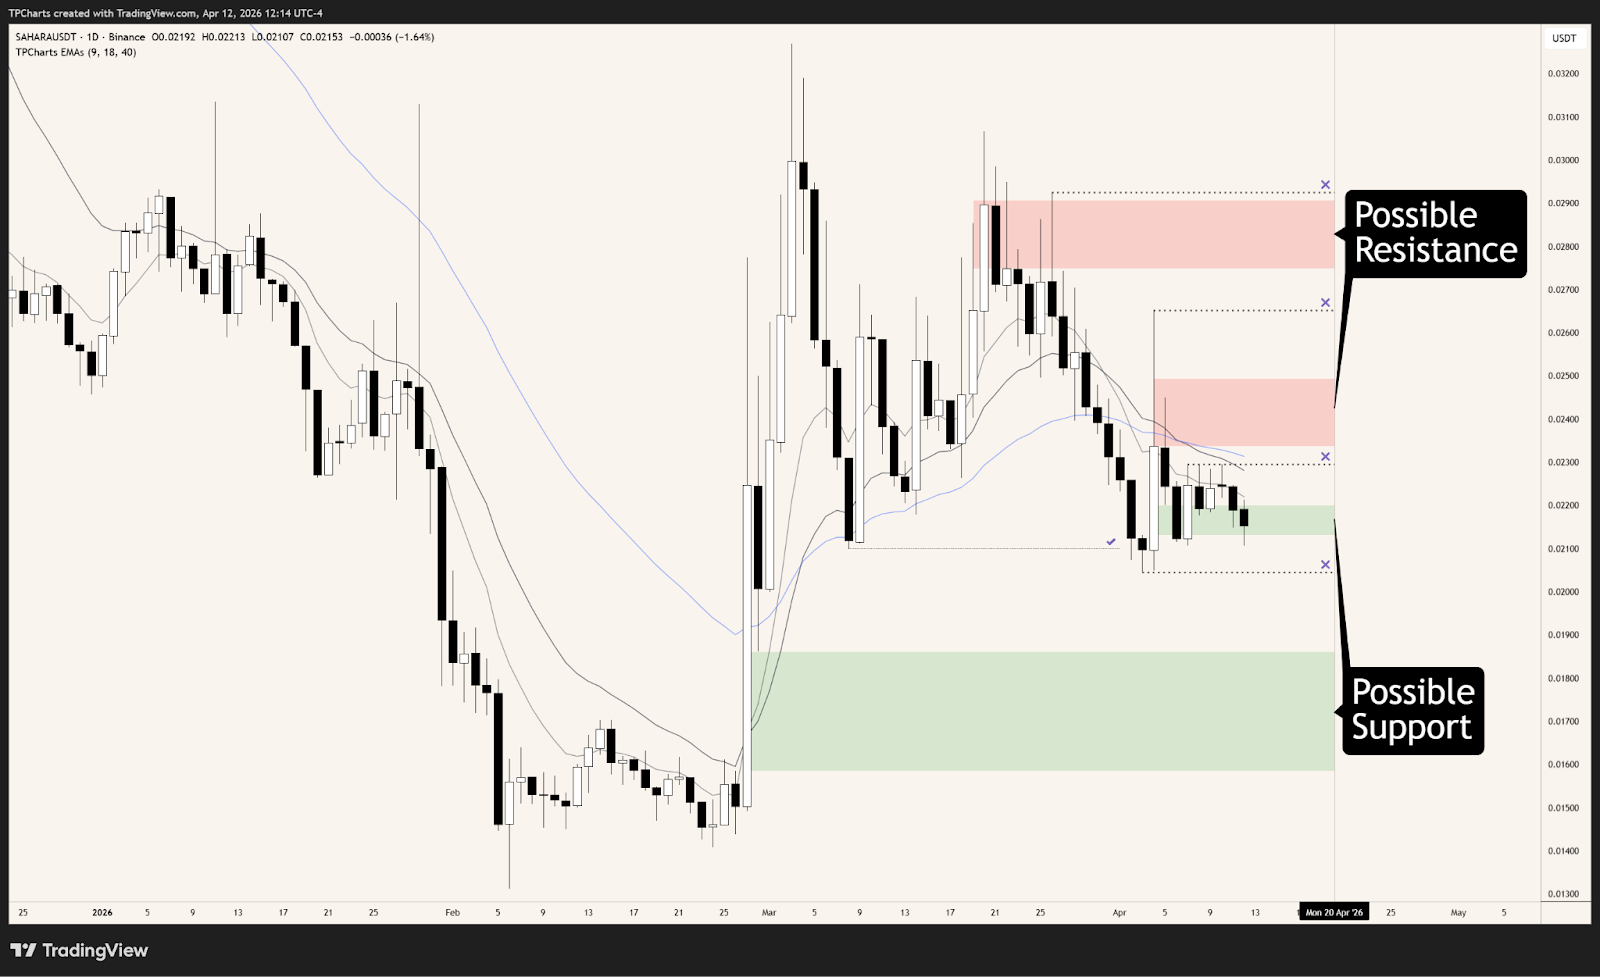
SAHARA is consolidating around the midpoint of February and March’s 149% bullish surge.
Bulls are clinging to support at $0.02202, April 4th’s bullish daily void. This level is near the midpoint of last week’s candle tail.
Bears’ stops above relatively equal daily swing highs might draw the price higher before any larger drop into resistance near $0.02337. This level, marked by April 4th’s bearish daily rejection, is confluent with the 40-day EMA. The long-anticipated release on April 16th may act as a short-term bullish price catalyst, potentially triggering a stop run above resistance.
If the price falls through the nearest support, it could seek January’s bullish monthly rejection at $0.01935. Under this level, in the lower half of February 23rd’s bullish weekly void, February 27th’s bullish daily void from $0.01862 to $0.01585 marks the next support.
A rally through the nearest resistance might continue through bears’ stops above April 4th’s swing high at $0.02653. Above this high, higher-timeframe resistance likely waits at $0.02749, March 16th’s bearish weekly rejection. It’s reasonable for the price to push slightly through this level to tap bears’ stops above March 26th’s swing high at $0.02926.
|
|
|
|
|
|
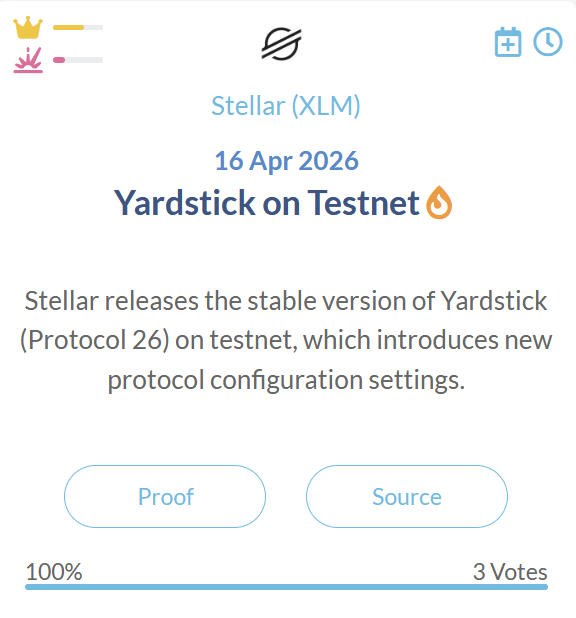
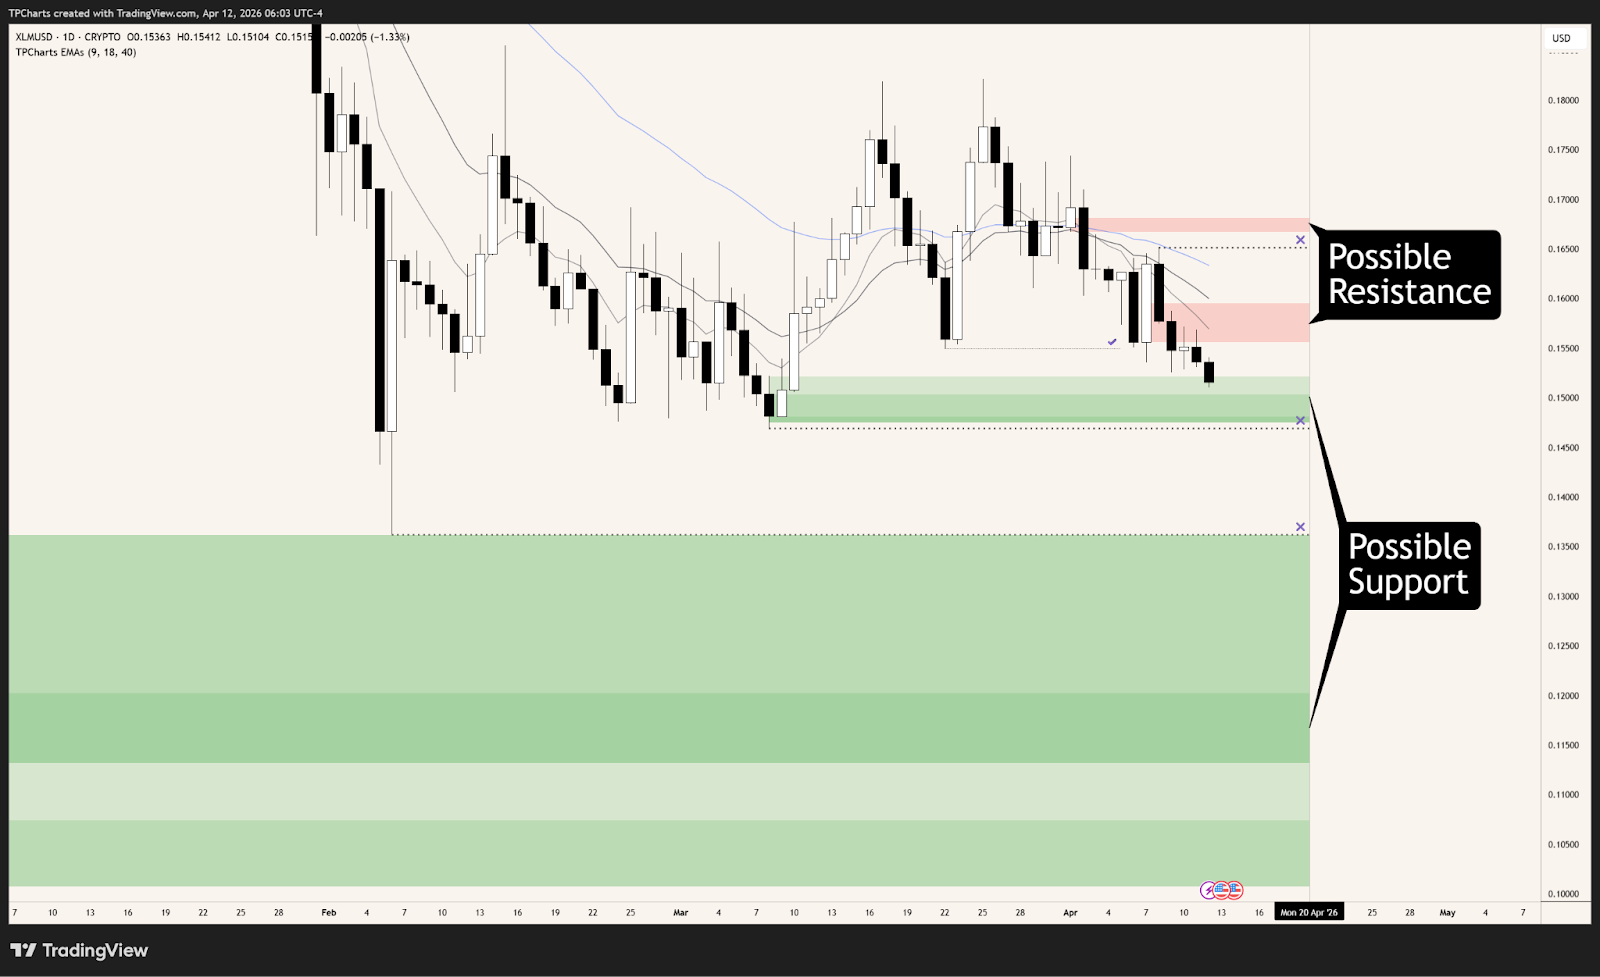
XLM bears are digging into support at the origin of the current range, which began in early February.
This support, marked by March 8th’s accumulation candle at $0.1522, is the bulls’ last line of defense for their stops under relatively equal swing lows around $0.1469. March 2nd’s bullish weekly rejection at $0.14816 offers higher-timeframe confluence, although a brief break of this level is reasonable before any reversal higher.
If Thursday’s Yardstick release on testnet goes smoothly, bulls may begin accumulating near these lows ahead of May 6th’s vote for Yardstick on Mainnet.
A steeper drop could rush to bulls’ stops under February’s low at $0.1363. Bordering this low, the unfilled part of November’s bullish monthly void reaches down to $0.1132, marking a broad area of higher-timeframe support.
Inside this void, the confluence of April 22nd’s swing high at $0.1203 and the unfilled part of November 11th’s bullish weekly void marks stronger potential support. Also inside this void, the upper half of November 4th’s bullish weekly void from $0.1075 to $0.1008 might prompt increased buying interest.
Resistance may begin near $0.1556, where distribution happened on April 7th. The 9- and 18-day EMAs add confluence to this level.
If the price begins a rally to test the top of the current multi-month range, bulls’ stops above April 8th’s swing high at $0.1652 offer the first major upside target. Above these highs, near March’s bearish monthly rejection at $0.1672, April 1st’s distribution candle at $0.1667 creates the next obstacle for bulls.
|
|
|
Enjoyed this issue? Share it with a friend
|
|
© 2026 CoinMarketCal
This newsletter is for informational purposes only and is not investment advice. Consult a licensed professional before making investment decisions.
You received this email because you signed up on our website.
|
|